| PROPORTIONAL REPRESENTATION ANALYSIS | |||||||||
| 1998 POLLS FOR 49TH LEGISLATIVE ASSEMBLY OF QUEENSLAND | |||||||||
| Estimated No. of PR (Hare-Clark) Seats in possible multi-member divisions | |||||||||
| Total first preference votes of winners of single-member (SM) divisions are in bold, coloured type. | |||||||||
| Largest no. of first preferences (a plurality) is underlined. Estimated no. of PR seats is at foot of each table. | |||||||||
| Of the 89 SM winners, the 72 without an absolute majority of first preferences are in italics and | |||||||||
| The 16 MLAs lacking a plurality include the MLAs for Aspley, Mount Omanney, and Redlands. | |||||||||
| Copyright
Proportional Representation Society of Australia 1998: 18 Anita Street,
Beaumaris 3193.
Tel. (03) 9589 1802, 0429 17672 Fax (03) 9589 1680 |
|||||||||
| www.prsa.org.au ggd@netspace.net.au Final ECQ data, from www.ecq.qld.gov.au | |||||||||
| PR DIV. | NO. 1 | 9 MLAs | 10.00% | PR
Quota= |
19154 |
TOTAL FIRST
PREFERENCES |
|
||
|
|
ALP | AD | GREEN | OTHER | LIB. | ONP | NAT. |
|
|
| Ashgrove | 593 | 1028 | 1044 | 7650 | 0 | 0 |
20003
|
|
|
| Aspley | 514 | 712 | 124 | 9801 | 3763 | 0 |
24646
|
|
|
| Chermside | 717 | 0 | 141 | 5623 | 2905 | 0 | 18731 |
|
|
| Clayfield | 7498 | 756 | 871 | 0 | 10107 | 0 | 0 | 19232 |
|
| Everton | 1120 | 0 | 0 | 7329 | 3481 | 0 | 22616 |
|
|
| Ferny Grove | 1224 | 989 | 0 | 6955 | 4333 | 0 | 24550 |
|
|
| Kedron | 910 | 0 | 448 | 4699 | 2661 | 0 | 18279 |
|
|
| Nudgee | 11788 | 0 | 734 | 172 | 4750 | 3632 | 0 | 21076 |
|
| Sandgate | 0 | 631 | 2055 | 4546 | 4176 | 0 | 22563 |
|
|
| TOTAL VOTES | 90502 | 5834 | 4965 | 3984 | 61460 | 24951 | 0 | 191696 |
|
| % OF SUB-TOTAL | 47.21 | 3.04 | 2.59 | 2.08 | 32.06 | 13.02 | 0.00 | 100.00 |
|
| NO. OF QUOTAS | 4.72 | 0.30 | 0.26 | 0.21 | 3.21 | 1.30 | 0.00 |
9.99
|
|
| ESTIM. PR SEATS | 5 | 0 | 0 | 0 | 3 | 1 | 0 | 9 |
|
| PR DIV. | NO. 2 | 9 MLAs | 10.00% | PR Quota= | 18465 |
|
TOTAL FIRST
PREFERENCES |
|
|
| SM DIVISIONS | ALP | AD | GREEN | OTHER | LIB. | ONP | NAT. |
|
|
| Brisbane Central | 10632 | 783 | 932 | 351 | 5179 | 1925 | 0 | 19802 |
|
| Bulimba | 11787 | 494 | 942 | 84 | 4393 | 3066 | 0 | 20766 |
|
| Greenslopes | 901 | 820 | 7902 | 0 | 0 | 19591 |
|
||
| Indooroopilly | 7908 | 1618 | 2049 | 0 | 0 | 0 | 21057 |
|
|
| Lytton | 12579 | 1385 | 1207 | 0 | 5859 | 0 | 0 | 21030 |
|
| Mount Coot-tha | 1199 | 2107 | 0 | 7273 | 0 | 0 | 20777 |
|
|
| Mount Ommaney | 9030 | 456 | 785 | 1885 | 2777 | 0 | 22977 |
|
|
| South Brisbane | 10591 | 1013 | 0 | 1431 | 5209 | 1592 | 0 | 19836 |
|
| Yeronga | 9979 | 0 | 1006 | 119 | 5323 | 2532 | 0 | 18959 |
|
| TOTAL VOTES | 92086 | 7534 | 9929 | 4690 | 58664 | 11892 | 0 | 184795 |
|
| % OF SUB-TOTAL | 49.83 | 4.08 | 5.37 | 2.54 | 31.75 | 6.44 | 0.00 | 100.00 |
|
| NO. OF QUOTAS | 4.98 | 0.41 | 0.54 | 0.25 | 3.17 | 0.64 | 0.00 | 9.99 |
|
| ESTIM. PR SEATS | 5 | 0 | 1 | 0 | 3 | 0 | 0 | 9 |
|
| *
* |
|||||||||
| PR DIV. | NO. 3 | 9 MLAs | 10.00% | PR
Quota= |
19961 |
TOTAL FIRST
PREFERENCES |
|
||
| SM DIVISIONS | ALP | AD | GREEN | OTHER | LIB. | ONP | NAT. |
|
|
| Capalaba | 11398 | 0 | 1215 | 2412 | 5748 | 0 | 0 | 20773 |
|
| Chatsworth | 11953 | 0 | 1126 | 0 | 6713 | 4015 | 0 |
23807
|
|
| Cleveland | 833 | 0 | 653 | 7391 | 4644 | 0 | 24027 |
|
|
| Mansfield | 625 | 817 | 0 | 9913 | 3696 | 0 | 25450 |
|
|
| Mount Gravatt | 455 | 720 | 76 | 6047 | 2519 | 0 | 18870 |
|
|
| Redlands | 10226 | 1092 | 0 | 302 | 0 | 6234 | 26557 |
|
|
| Springwood | 878 | 0 | 539 | 6270 | 3691 | 0 | 18425 |
|
|
| Sunnybank | 0 | 1172 | 0 | 8229 | 4646 | 0 |
26738
|
|
|
| Woodridge | 8009 | 923 | 0 | 0 | 2169 | 4401 | 0 | 15502 |
|
| TOTAL VOTES | 91282 | 4806 | 5050 | 3982 | 52480 | 33846 | 8703 | 200149 |
|
|
|
45.61 | 2.40 | 2.52 | 1.99 | 26.22 | 16.91 | 4.35 | 100.00 |
|
| NO. OF QUOTAS | 4.56 | 0.24 | 0.25 | 0.20 | 2.62 | 1.69 |
0.43
|
9.99
|
|
| ESTIM. PR SEATS | 5 | 0 | 0 | 0 | 3 | 1 | 0 | 9 |
|
| PROPORTIONAL REPRESENTATION ANALYSIS | |||||||||
| 1998 POLLS FOR 49TH LEGISLATIVE ASSEMBLY OF QUEENSLAND | |||||||||
| Estimated No. of PR (Hare-Clark) Seats in possible multi-member divisions | |||||||||
| Total first preference votes of winners of single-member (SM) divisions are in bold, coloured type. | |||||||||
| Largest no. of first preferences (a plurality) is underlined. Estimated no. of PR seats is at the foot of each table. | |||||||||
| Of the 89 SM winners, the 72 without an absolute majority of first preferences are in italics and | |||||||||
| The 16 MLAs lacking a plurality include the MLAs for | |||||||||
| Caboolture, Burnett, Gladstone, Gympie, Harvey Bay, Keppel and Nicklin. | |||||||||
| Copyright
Proportional Representation Society of Australia 1998: 18 Anita Street,
Beaumaris 3193.
Tel. (03) 9589 1802, 0429 176725 Fax (03) 9589 1680 |
|||||||||
| www.prsa.org.au ggd@netspace.net.au Final ECQ data, from www.ecq.qld.gov.au | |||||||||
| PR DIV. | NO. 4 | 9 MLAs | 10.00% | PR
Quota= |
20819 |
TOTAL FIRST
PREFERENCES |
|
||
| SM DIVISIONS | ALP | AD | GREEN | OTHER | LIB. | ONP | NAT. |
|
|
| Albert | 9772 | 0 | 1472 | 305 | 0 | 7909 | 29378 |
|
|
| Broadwater | 6650 | 0 | 956 | 0 | 0 | 5802 | 22164 |
|
|
| Burleigh | 6581 | 0 | 995 | 0 | 0 | 4403 | 20410 |
|
|
| Currumbin | 0 | 898 | 56 | 3155 | 4537 | 4475 |
22103
|
|
|
| Merrimac | 6405 | 601 | 0 | 0 | 4487 | 0 |
22586
|
|
|
| Nerang | 7406 | 569 | 1572 | 138 | 6719 | 0 | 26740 |
|
|
| Southport | 8429 | 735 | 0 | 0 | 0 | 4907 | 23071 |
|
|
| Surfers Paradise | 4167 | 0 | 894 | 0 | 0 | 3354 | 10880 | 19295 |
|
| Waterford | 0 | 0 | 0 | 5571 | 6643 | 0 | 22708 |
|
|
| TOTAL VOTES | 68886 | 1905 | 6787 | 499 | 30155 | 48761 |
51462
|
208187
|
|
| % OF SUB-TOTAL | 33.05 | 0.92 | 3.26 | 0.24 | 14.47 | 23.39 | 24.69 | 100.00 |
|
| NO. OF QUOTAS | 3.30 | 0.09 | 0.33 | 0.02 | 1.45 | 2.34 |
2.47
|
9.99
|
|
| ESTIM. PR SEATS | 3 | 0 | 0 | 0 | 1 | 2 |
3
|
9
|
|
| PR DIV. | NO. 5 | 9 MLAs | 10.00% | PR
Quota= |
22136 |
TOTAL FIRST
PREFERENCES |
|
||
| SM DIVISIONS | ALP | AD | GREEN | OTHER | LIB. | ONP | NAT. |
|
|
| Caboolture | 10471 | 581 | 0 | 1471 | 0 | 6222 | 26753 |
|
|
| Caloundra | 6680 | 0 | 1086 | 468 | 5930 | 0 | 23789 |
|
|
| Kallangur | 0 | 898 | 1629 | 6583 | 8077 | 0 | 29984 |
|
|
| Kurwongbah | 0 | 13714 | 0 | 5423 | 5312 | 0 | 23963 |
|
|
| Maroochydore | 5635 | 709 | 1157 | 0 | 0 | 6443 | 23370 |
|
|
| Mooloolah | 6222 | 0 | 1432 | 0 | 6173 | 0 | 25948 |
|
|
| Murrumba | 658 | 0 | 266 | 4741 | 6429 | 0 | 22360 |
|
|
| Nicklin | 5426 | 695 | 0 | 0 | 6039 | 6878 | 25600 |
|
|
| Redcliffe | 0 | 0 | 777 | 5864 | 4370 | 0 | 19147 |
|
|
| TOTAL VOTES | 77490 | 2643 | 5944 | 11173 | 44357 | 56781 |
22526
|
220914
|
|
| % OF SUB-TOTAL | 35.08 | 1.20 | 2.69 | 5.06 | 20.08 | 25.70 |
10.20
|
100.00
|
|
| NO. OF QUOTAS | 3.51 | 0.12 | 0.27 | 0.51 | 2.01 | 2.57 |
1.02
|
9.99
|
|
| ESTIM. PR SEATS | 4 | 0 | 0 | 0 | 2 | 2 | 1 |
|
|
| PR DIV. | NO. 6 | 9 MLAs | 10.00% | PR
Quota= |
20855 |
TOTAL FIRST
PREFERENCES |
|
||
| SM DIVISIONS | ALP | AD | GREEN | OTHER | LIB. | ONP | NAT. |
|
|
| Bundaberg | 198 | 303 | 0 | 0 | 5819 | 4709 | 19830 |
|
|
| Burnett | 7607 | 0 | 786 | 201 | 0 | 10076 |
27663
|
|
|
| Gladstone | 10897 | 0 | 0 | 0 | 0 | 1271 | 22980 |
|
|
| Gympie | 5806 | 0 | 764 | 0 | 0 | 8745 | 22286 |
|
|
| Hervey Bay | 9213 | 325 | 314 | 0 | 0 | 6968 | 25404 |
|
|
| Keppel | 8134 | 546 | 0 | 3745 | 0 | 5430 |
25437
|
|
|
| Maryborough | 7163 | 0 | 576 | 0 | 0 | 3787 | 20065 |
|
|
| Noosa | 7871 | 0 | 1618 | 1161 | 3767 | 0 | 26349 |
|
|
| Rockhampton | 9690 | 740 | 0 | 0 | 0 | 4919 | 3677 |
19026
|
|
| TOTAL VOTES | 75182 | 1809 | 4361 | 15919 | 11932 | 55879 | 43958 | 209040 | 104525 |
| % OF SUB-TOTAL | 35.97 | 0.87 | 2.09 | 7.62 | 5.71 | 26.73 | 21.03 | 100.00 | SM % of PR option is: |
| NO. OF QUOTAS | 3.60 | 0.09 | 0.21 | 0.76 | 0.57 | 2.67 | 2.10 | 9.99 | 55.6% |
| ESTIM. PR SEATS | 3 | 0 | 0 | 1 | 0 | 3 | 2 | 9 | 188145 |
|
|
|||||||||
| PROPORTIONAL REPRESENTATION ANALYSIS | |||||||||
| 1998 POLLS FOR 49TH LEGISLATIVE ASSEMBLY OF QUEENSLAND | |||||||||
| Estimated No. of PR (Hare-Clark) Seats in possible multi-member divisions | |||||||||
| Total first preference votes of winners of single-member (SM) divisions are in bold, coloured type. | |||||||||
| Largest no. of first preferences (a plurality) is underlined. Estimated no. of PR seats is at the foot of each table. | |||||||||
| Of the 89 SM winners, the 72 without an absolute majority of first preferences are in italics and | |||||||||
| The 16 MLAs lacking a plurality include the MLAs for Ipswich West and Mirani. | |||||||||
| Copyright
Proportional Representation Society of Australia 1998: 18 Anita Street,
Beaumaris 3193.
Tel. (03) 9589 1802, 0429 176725 Fax (03) 9589 1680 |
|||||||||
| www.prsa.org.au ggd@netspace.net.au Final ECQ data, from www.ecq.qld.gov.au | |||||||||
| PR DIV. | NO. 7 | 7 MLAs | 12.50% | PR
Quota= |
19616 |
TOTAL FIRST
PREFERENCES
|
|
||
| SM DIVISIONS | ALP | AD | GREEN | OTHER | LIB. | ONP | NAT. |
|
|
| Archerfield | 0 | 826 | 497 | 6112 | 5251 | 0 | 25139 |
|
|
| Bundamba | 577 | 614 | 0 | 2472 | 7135 | 0 | 20828 |
|
|
| Inala | 12748 | 1618 | 1020 | 373 | 3253 | 0 | 0 | 19012 |
|
| Ipswich | 0 | 666 | 194 | 2207 | 8281 | 0 | 20949 |
|
|
| Ipswich West | 9658 | 0 | 0 | 416 | 0 | 4065 | 23039 |
|
|
| Logan | 495 | 0 | 1441 | 0 | 7202 | 3695 | 25186 |
|
|
| Moggill | 7739 | 1531 | 1436 | 0 | 12202 | 0 | 0 | 22908 |
|
| TOTAL VOTES | 74582 | 4221 | 4562 | 2921 | 26246 | 3679 | 7760 |
|
|
| % OF SUB-TOTAL | 47.49 | 2.69 | 2.90 | 1.86 | 16.71 | 23.41 | 4.94 | 100.00 |
|
| NO. OF QUOTAS | 3.80 | 0.21 | 0.23 | 0.15 | 1.34 | 1.87 | 0.40 |
|
|
| ESTIM. PR SEATS | 4 | 0 | 0 | 0 | 1 | 2 | 0 | 7 |
|
|
|
|||||||||
| PR DIV. | NO. 8 | 7 MLAs | 12.50% | PR
Quota= |
19543 |
TOTAL FIRST
PREFERENCES
|
|
||
| SM DIVISIONS | ALP | AD | GREEN | OTHER | LIB. | ONP | NAT. |
|
|
| Beaudesert | 7388 | 0 | 721 | 1252 | 0 | 6464 | 23591 |
|
|
| Crows Nest | 3908 | 0 | 704 | 635 | 0 | 9342 | 23649 |
|
|
| Cunningham | 4535 | 0 | 0 | 1328 | 0 | 7774 | 24021 |
|
|
| Lockyer | 5324 | 0 | 0 | 3608 | 0 | 6473 | 25348 |
|
|
| Toowoomba North | 6634 | 0 | 0 | 319 | 0 | 4654 | 19285 |
|
|
| Toowoomba South | 5615 | 0 | 0 | 357 | 0 | 4748 | 20048 |
|
|
| Warwick | 4091 | 0 | 814 | 0 | 0 | 6242 | 20590 |
|
|
| TOTAL VOTES | 37495 | 0 | 2239 | 7499 | 0 | 49167 | 60132 | 156532 |
|
| % OF SUB-TOTAL | 23.95 | 0.00 | 1.43 | 4.79 | 0.00 | 31.41 | 38.42 | 100.00 |
|
| NO. OF QUOTAS | 1.92 | 0.00 | 0.11 | 0.38 | 0.00 | 2.51 | 3.07 | 7.99 | 57.1% |
| ESTIM. PR SEATS | 2 | 0 | 0 | 0 | 0 | 2 | 3 | 7 |
|
|
|
|
|
|
|
|
|
|
|
|
|
|
PR DIV. | NO. 9 | 7 MLAs | 12.50% | PR
Quota= |
16416 |
TOTAL FIRST
PREFERENCES
|
|
|
| SM DIVISIONS | ALP | AD | GREEN | OTHER | LIB. | ONP | NAT. |
|
|
| Barambah | 3794 | 0 | 0 | 1749 | 0 | 6731 | 21738 |
|
|
| Callide | 3335 | 0 | 0 | 1013 | 0 | 6566 | 17511 |
|
|
| Fitzroy | 10214 | 241 | 0 | 641 | 0 | 4402 | 4069 | 19567 |
|
| Gregory | 4228 | 303 | 0 | 750 | 0 | 2554 | 14708 |
|
|
| Mirani | 8768 | 0 | 0 | 630 | 0 | 7054 | 24597 |
|
|
| Warrego | 3287 | 0 | 0 | 1261 | 0 | 3118 | 13216 |
|
|
| Western Downs | 3544 | 0 | 0 | 0 | 0 | 7068 | 20476 |
|
|
| TOTAL VOTES | 37170 | 544 | 0 | 6044 | 0 | 40226 | 47829 | 131813 | 65910 |
| % OF SUB-TOTAL | 28.20 | 0.41 | 0.00 | 4.59 | 0.00 | 30.52 | 36.29 | 100.00 | SM % of PR option is: |
| NO. OF QUOTAS | 2.26 | 0.03 | 0.00 | 0.37 | 0.00 | 2.44 | 2.90 | 7.99 | 57.1% |
| ESTIM. PR SEATS | 2 | 0 | 0 | 0 | 0 | 2 | 3 | 7 |
|
|
|
|
|
|
|
|
|
|
|
|
| PROPORTIONAL REPRESENTATION ANALYSIS | |||||||||
| 1998 POLLS FOR 49TH LEGISLATIVE ASSEMBLY OF QUEENSLAND | |||||||||
| Estimated No. of PR (Hare-Clark) Seats in possible multi-member divisions | |||||||||
| Total first preference votes of winners of single-member (SM) divisions are in bold, coloured type. | |||||||||
| Largest no. of first preferences (a plurality) is underlined. Estimated no. of PR seats is at the foot of each table. | |||||||||
| Of the 89 SM winners, the 72 without an absolute majority of first preferences are in italics and | |||||||||
| The 16 MLAs lacking a plurality include the MLAs for Charters Towers, Thuringowa, Whitsunday and Mulgrave. | |||||||||
| Copyright
Proportional Representation Society of Australia 1998: 18 Anita Street,
Beaumaris 3193.
Tel. (03) 9589 1802, 0429 176725 Fax (03) 9589 1680 |
|||||||||
| www.prsa.org.au ggd@netspace.net.au Final ECQ data, from www.ecq.qld.gov.au | |||||||||
| PR DIV. | NO. 10 | 7 MLAs | 12.50% | PR
Quota= |
18201 |
TOTAL FIRST
PREFERENCES
|
|
||
| SM DIVISIONS | ALP | AD | GREEN | OTHER | LIB. | ONP | NAT. |
|
|
| Burdekin | 7307 | 535 | 0 | 963 | 0 | 6693 |
23155
|
|
|
| Charters Towers | 5758 | 0 | 0 | 230 | 0 | 4066 | 15508 |
|
|
| Mackay | 0 | 0 | 272 | 0 | 5323 | 4503 | 19701 |
|
|
| Mundingburra | 0 | 0 | 0 | 6011 | 4807 | 0 | 19574 |
|
|
| Thuringowa | 8976 | 518 | 0 | 278 | 4430 | 2434 | 25554 |
|
|
| Townsville | 0 | 0 | 738 | 5411 | 4948 | 0 |
20045
|
|
|
| Whitsunday | 8670 | 0 | 0 | 0 | 0 | 6452 |
21825
|
|
|
| TOTAL VOTES | 580018 | 1053 | 0 | 2481 | 15852 | 42422 | 25536 | 145362 | 72685 |
| % OF SUB-TOTAL | 39.91 | 0.72 | 0.00 | 1.71 | 10.91 | 29.18 | 17.57 | 100.00 | SM % of PR option is: |
| NO. OF QUOTAS | 3.19 | 0.06 | 0.00 | 0.14 | 0.87 | 2.33 | 1.41 | 7.99 | 57.1% |
| ESTIM. PR SEATS | 3 | 0 | 0 | 0 | 1 | 2 | 1 | 7 | 127197 |
|
|
|||||||||
| PR DIV. | NO. 11 | 7 MLAs | 12.50% | PR Quota= | 16224 |
|
TOTAL FIRST
PREFERENCES
|
|
|
| SM DIVISIONS | ALP | AD | GREEN | OTHER | LIB. | ONP | NAT. |
|
|
| Barron River | 313 | 1037 | 270 | 6050 | 5457 | 0 | 20245 |
|
|
| Cairns | 0 | 835 | 994 | 4318 | 5067 | 0 |
18400
|
|
|
| Cook | 8370 | 0 | 0 | 833 | 0 | 3124 | 2989 | 15316 |
|
| Hinchinbrook | 6008 | 0 | 0 | 1078 | 0 | 6172 | 20933 |
|
|
| Mount Isa | 7562 | 0 | 0 | 297 | 0 | 3175 | 1900 | 12934 |
|
| Mulgrave | 8464 | 457 | 0 | 0 | 0 | 6848 | 22866 |
|
|
| Tablelands | 4973 | 0 | 0 | 0 | 0 | 6521 | 19829 |
|
|
| TOTAL VOTES | 49681 | 770 | 1872 | 3472 | 10368 | 38427 | 25933 | 130523 | 65265 |
| % OF SUB-TOTAL | 38.06 | 0.59 | 1.43 | 2.66 | 7.94 | 29.44 | 19.87 | 100.00 | SM % of PR option is: |
| NO. OF QUOTAS | 3.04 | 0.05 | 0.11 | 0.21 | 0.64 | 2.36 | 1.59 | 7.99 | 57.1% |
| ESTIM. PR SEATS | 3 | 0 | 0 | 0 | 0 | 2 | 2 | 7 | 114232 |
|
|
|||||||||
| ALP | AD | GREEN | OTHER | LIB. | ONP | NPA | TOTAL | ||
| TOTAL FIRST PREF. VOTES | 752374 | 31119 | 45709 | 62664 | 311514 | 439121 | 293839 | 1936340 | |
| TOTAL HARE-CLARK PR SEATS | 39 | 0 | 1 | 1 | 15 | 19 | 14 | 89 | |
| TOTAL SINGLE-MEMBER SEATS | 44 | 0 | 0 | 2 | 9 | 11 | 23 | 89 | |
|
|
|||||||||
| ALP | AD | GREEN | OTHER | LIB. | ONP | NPA | TOTAL | ||
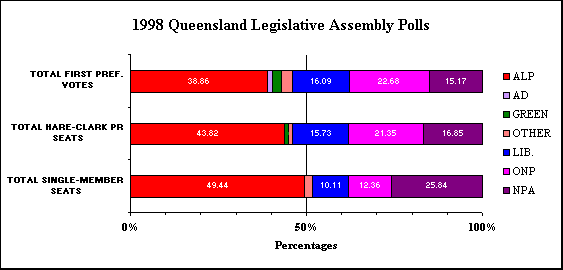
| TOTAL FIRST PREF. VOTES | 38.86 | 1.61 | 2.36 | 3.24 | 16.09 | 22.68 | 15.17 | 100.00 | |
| TOTAL HARE-CLARK PR SEATS | 43.82 | 0.00 | 1.12 | 1.12 | 16.85 | 21.35 | 15.73 | 100.00 | |
| TOTAL SINGLE-MEMBER SEATS | 49.44 | 0.00 | 0.00 | 2.25 | 10.11 | 12.36 | 25.84 | 100.00 | |
The table above shows that the new Beattie ALP Government, plus its one Independent supporter, jointly gained only 40.48% of first preference votes, yet they gained 50.56% of the single-member seats. The table shows that this unjust imbalance would not apply under a Hare-Clark proportional representation electoral system, where the seats for ALP, Greens and both Independents jointly would be only 46.06%. The graph below illustrates this.
The percentage of NPA-Liberal Hare-Clark seats (32.58%) would have allowed that coalition to continue governing as long as at least 16 of the 19 MLAs of the One Nation Party, which party would hold the remainder of the seats (21.35%), voted against no-confidence motions, as the 28 Coalition MLAs other than the Speaker and those 16 One Nation MLAs, would together hold 44 of the 88 seats on the floor of Parliament. That is enough, with the Speaker's casting vote, to defeat a motion of no-confidence. Alternatively, for the ALP to force a change of government under Hare-Clark with the vote it gained, 6 other MLAs would have to support it.
With Hare-Clark casual vacancies filled by countback of
general election ballot-papers, as for the Tasmanian and ACT Assemblies,
the predictable party continuity lets Governments last full term.